
Painting a more engaging picture
One of the questions we get asked a lot is “how much detail is enough?”
It’s a great question and one that, in reality, will vary from adviser to adviser; client to client.
Truth lets you customise the client experience, including how you classify assets, income, and expenditure. Travelling around the country to our regional user groups, I see lots of advisers deliver case studies using our software. Often they’ve been using our system for many years, and are yet to take advantage of this customisation. In this blog, we’ll take a brief look at how you easy it is to break down a client’s finances in a way that paints a more engaging picture.
Something generic this way comes
One of the issues with painting a broad-strokes picture for a client is that they don’t recognise themselves in the picture you’re trying to paint for them on screen. If a 50-year-old client tells you “I’m earning £140k a year and spending £80k”, what is their response likely to be if you show them a statement showing them earning £140k a year and spending £80k? They will nod politely, and move on.
Why does this happen? Simple – what you’re showing them on screen is too generic. It could just as well be a statement for any client of a similar age, in a similar position. They don’t recognise themselves in the images they’re seeing on screen.
How do we encourage clients to engage more closely with the process? Even more simple! We show them a picture which leaves them saying, without a shadow of a doubt, “this is me“.
The problem with simplicity
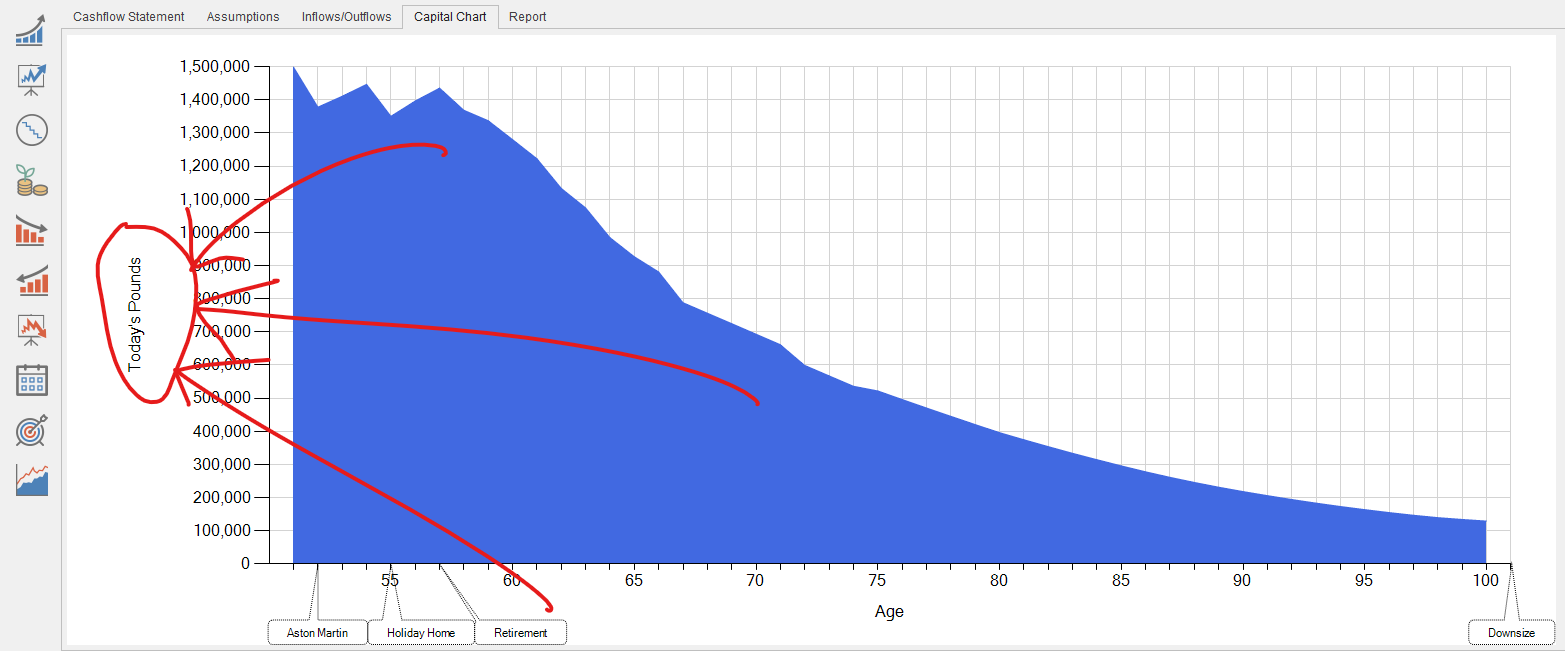
Take a look at the chart below. This is an analysis of Michael and Jane’s income for the rest of their lives:
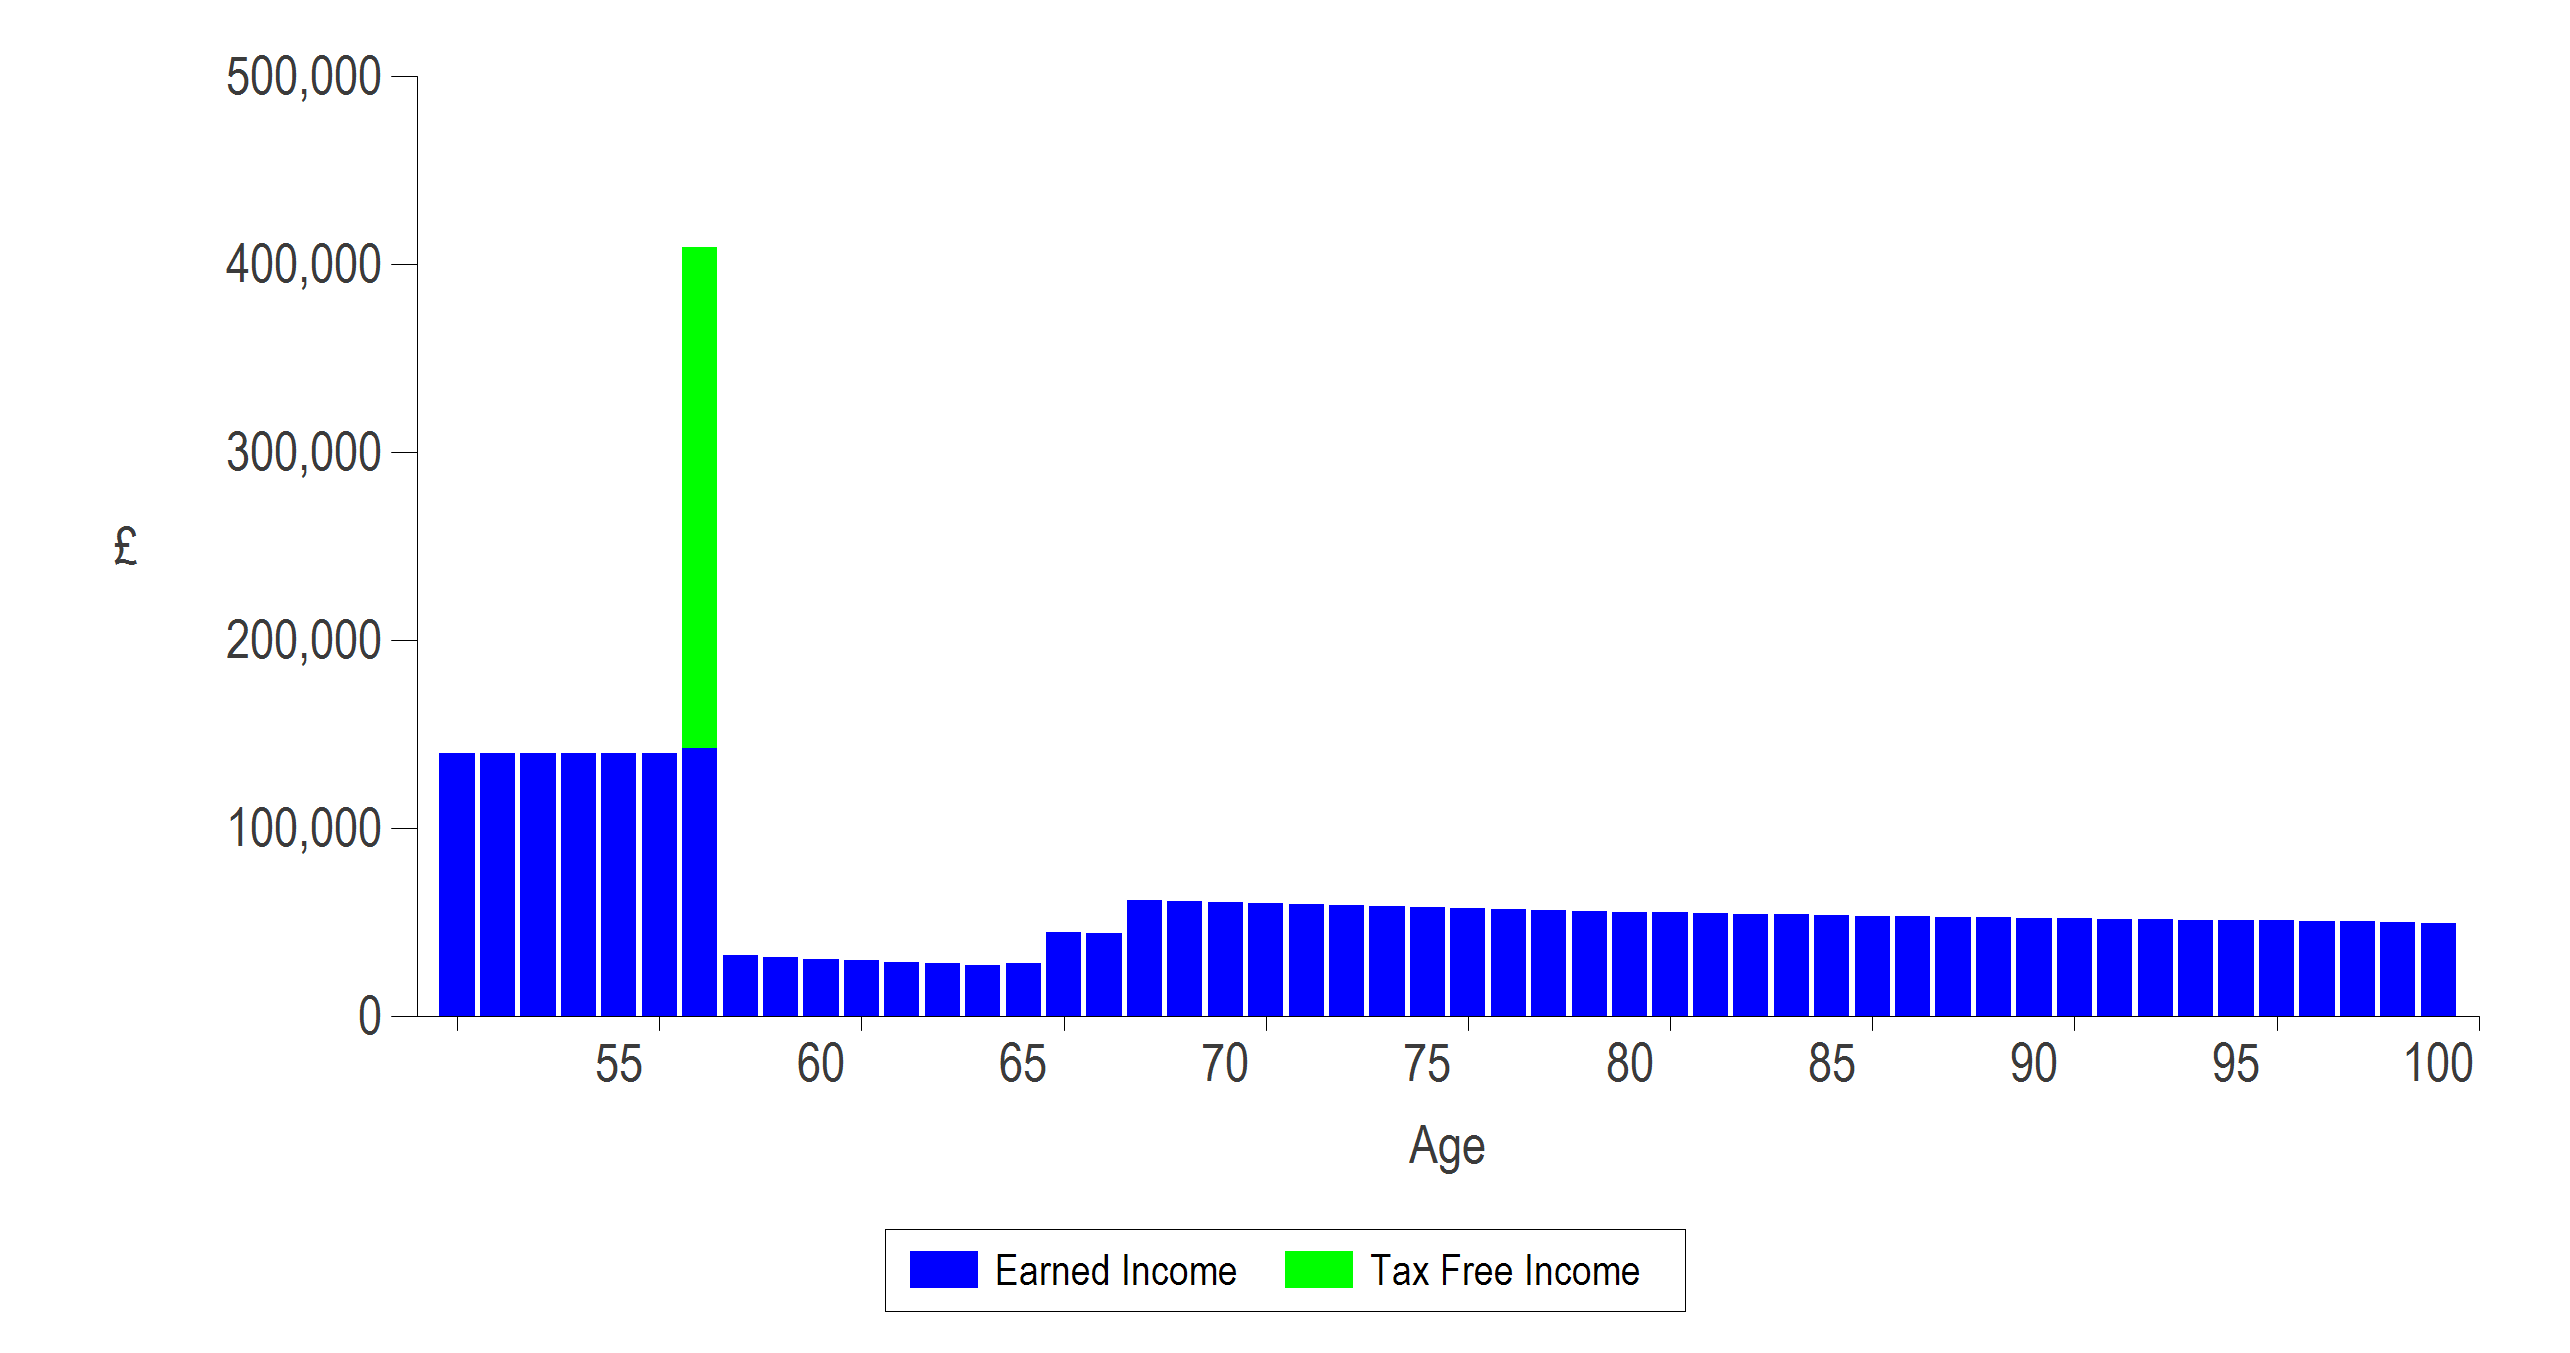
I’m sure you’ll agree that it’s an utterly unengaging picture.
OK, they’re earning £140k a year. I also happen to know that they’re looking to retire at 57 – the big spike of “Tax-Free Income” is presumably the PCLS from Michael’s pension. Beyond that, it’s just a lot of blue lines. I’d struggle to explain it myself, let alone engage with it as a client.
Let’s take a look at their £80k a year of expenditure:
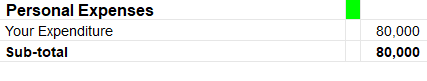 Here you go, Mr & Mrs Client – you said you were spending £80k a year and you were absolutely right. Mr Client stifles a yawn and Mrs Client tries to work out if that cloud in the distance looks more like a cow or a horse.
Heading(s) in the right direction…
So what? With a few simple tweaks, we can turn this basic data into a detailed, engaging portrait of my clients’ lives. Rather than staring out the window they’ll be asking you to adjust assumptions, experimenting with solutions, and looking forward to their next client meeting so they can “play” with their cashflow!
Let’s start with their income. In the example above I’ve simply broken their income down by how it’s taxed. But what’s all the “Earned Income” in retirement? You might not have guessed, but it’s a number of things:
- State Pension
- Taxable drawdown income from Michael’s DC pension scheme
- Taxable income from Jane’s DB pension scheme
So how do we paint that more engaging picture for the client?
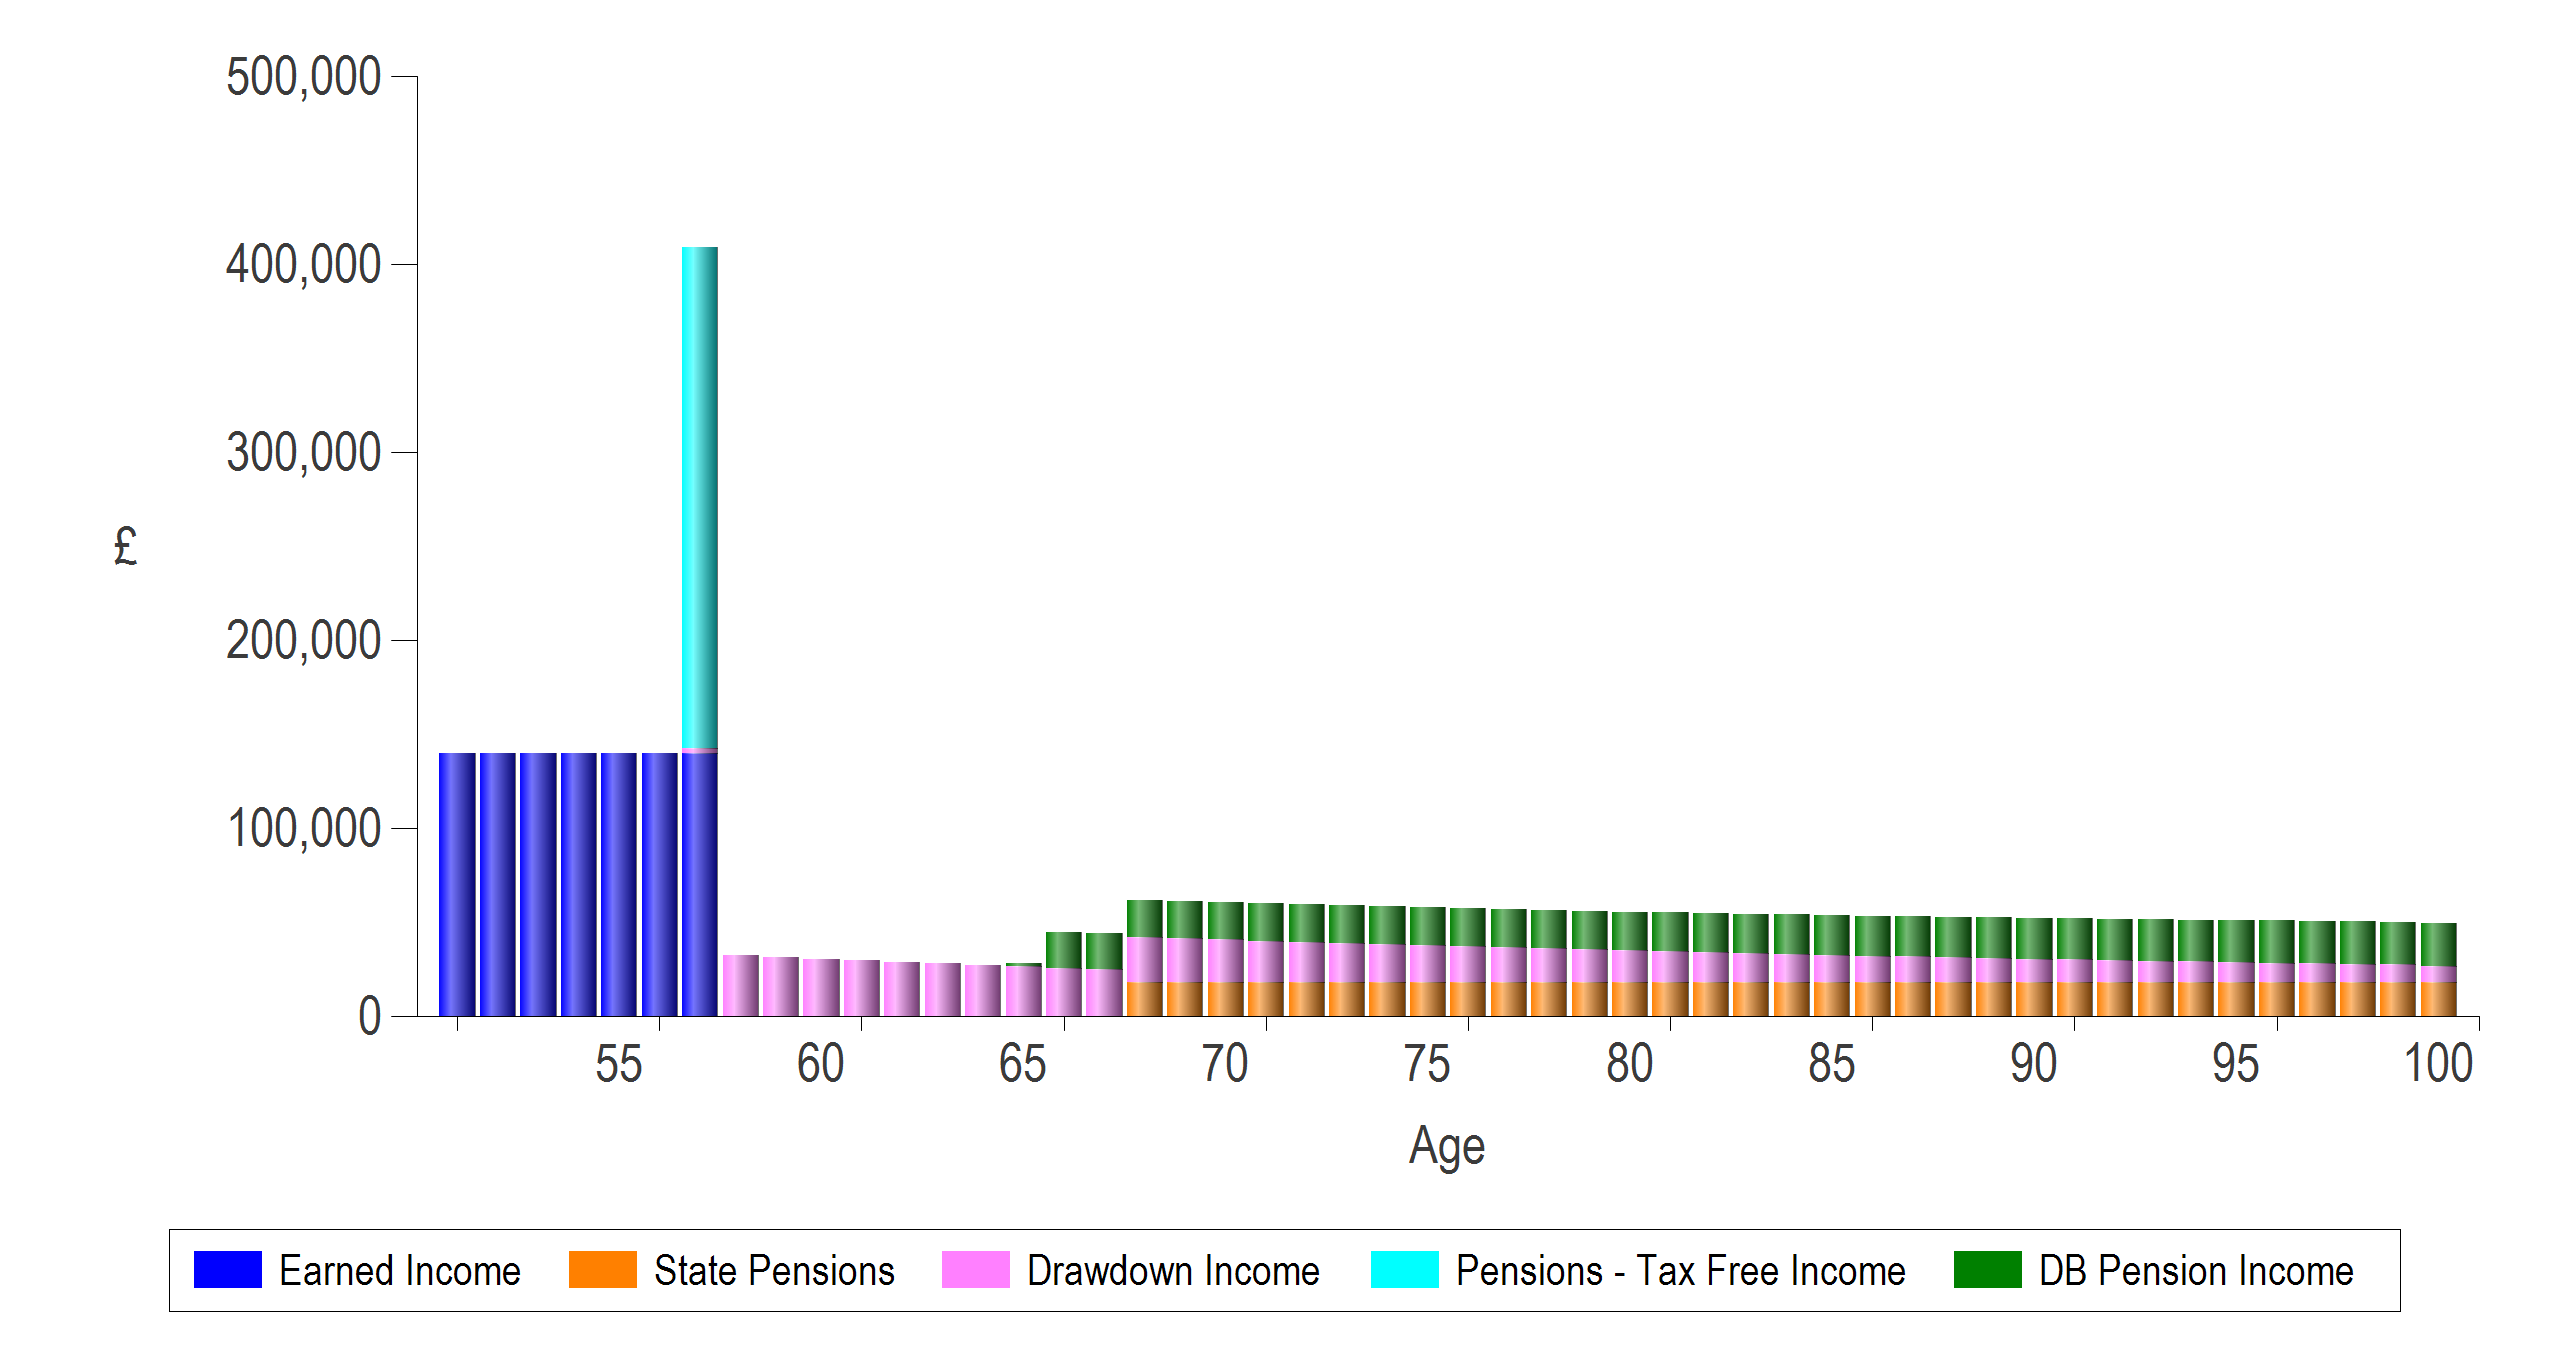
Believe it or not, this is the same data, for the same client. All I’ve done is tweaked some headings in the software!
Now we can see much more of the narrative of Michael and Jane’s lives. We can see that they are starting drawdown (pink) at retirement. If you squint a bit, you can see that there’s a tiny bit of pink at age 57. Michael is planning on starting drawdown while he’s still working. Maybe this is something we need to talk to him about?
At age 65, Jane’s DB pension (green) comes into payment. A couple of years later their State Pensions (orange) kick in.
Going granular
Our software has something of a reputation for going into too much detail. We’re not sure why this is, as our users can choose for themselves how much detail they want to show. As you can see above, this could be as simple as a single entry for “Your Expenditure” at £80k a year, carrying on forever.
Of course, we can’t ignore Income Tax and NI. We’re always calculating these for you on any income you’ve specified. Let’s look at another frankly boring chart:
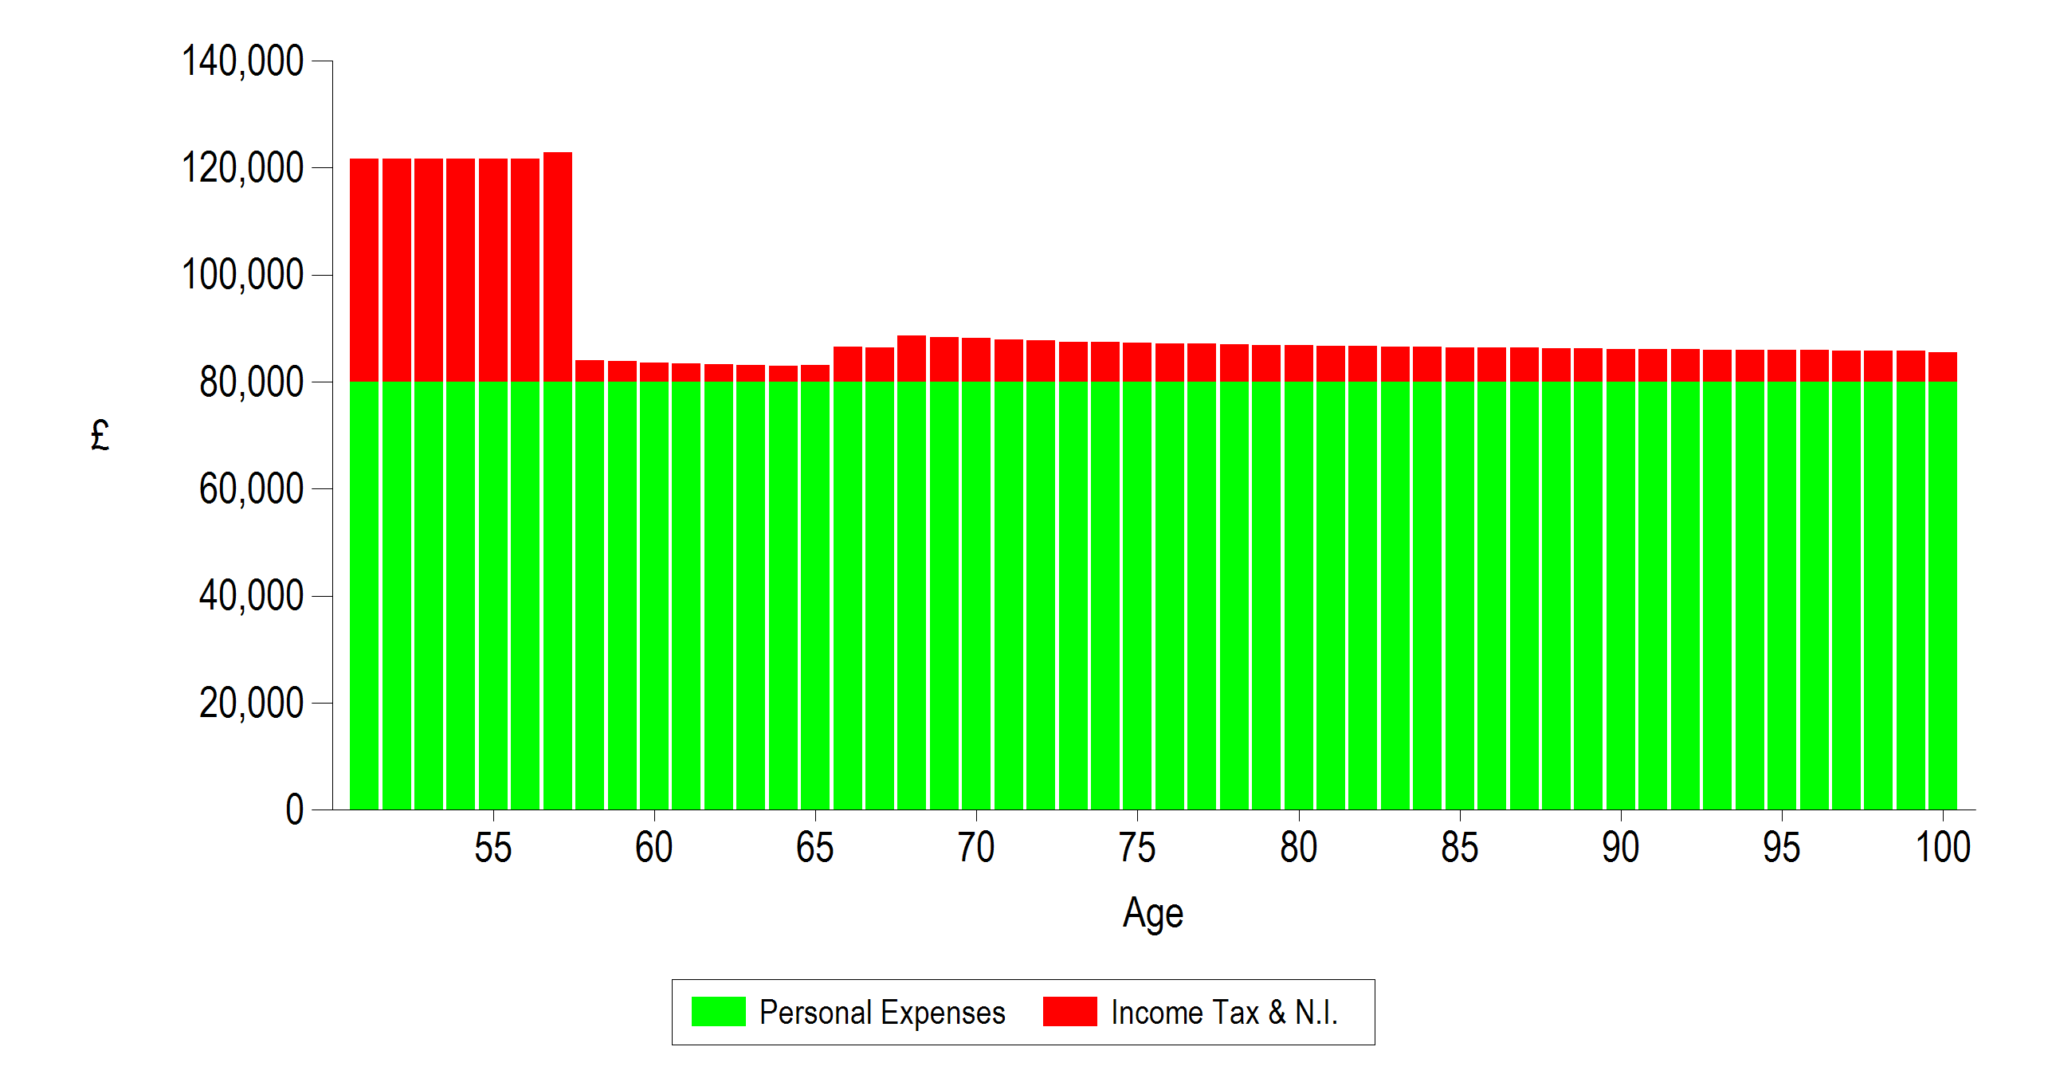
Nothing wrong with this – it will generate a cashflow at the end, but it’s not exactly exciting. If Leonardo Da Vinci had cross-stitched the Mona Lisa, it probably wouldn’t be a celebrated masterpiece, attracting thousands of tourists a year, and taking pride of place in the Louvre.
So let’s introduce some granularity. Where is that £80k really going? Let’s say they’re spending:
- £30k on “Bills & Essentials”
- £15k on “School Fees & Childcare”
- £10k on “Holidays & Hobbies”
- £10k on “Motoring”
- £15k on “Investments” (covering ISA and Pension contributions)
How does the same chart look now?
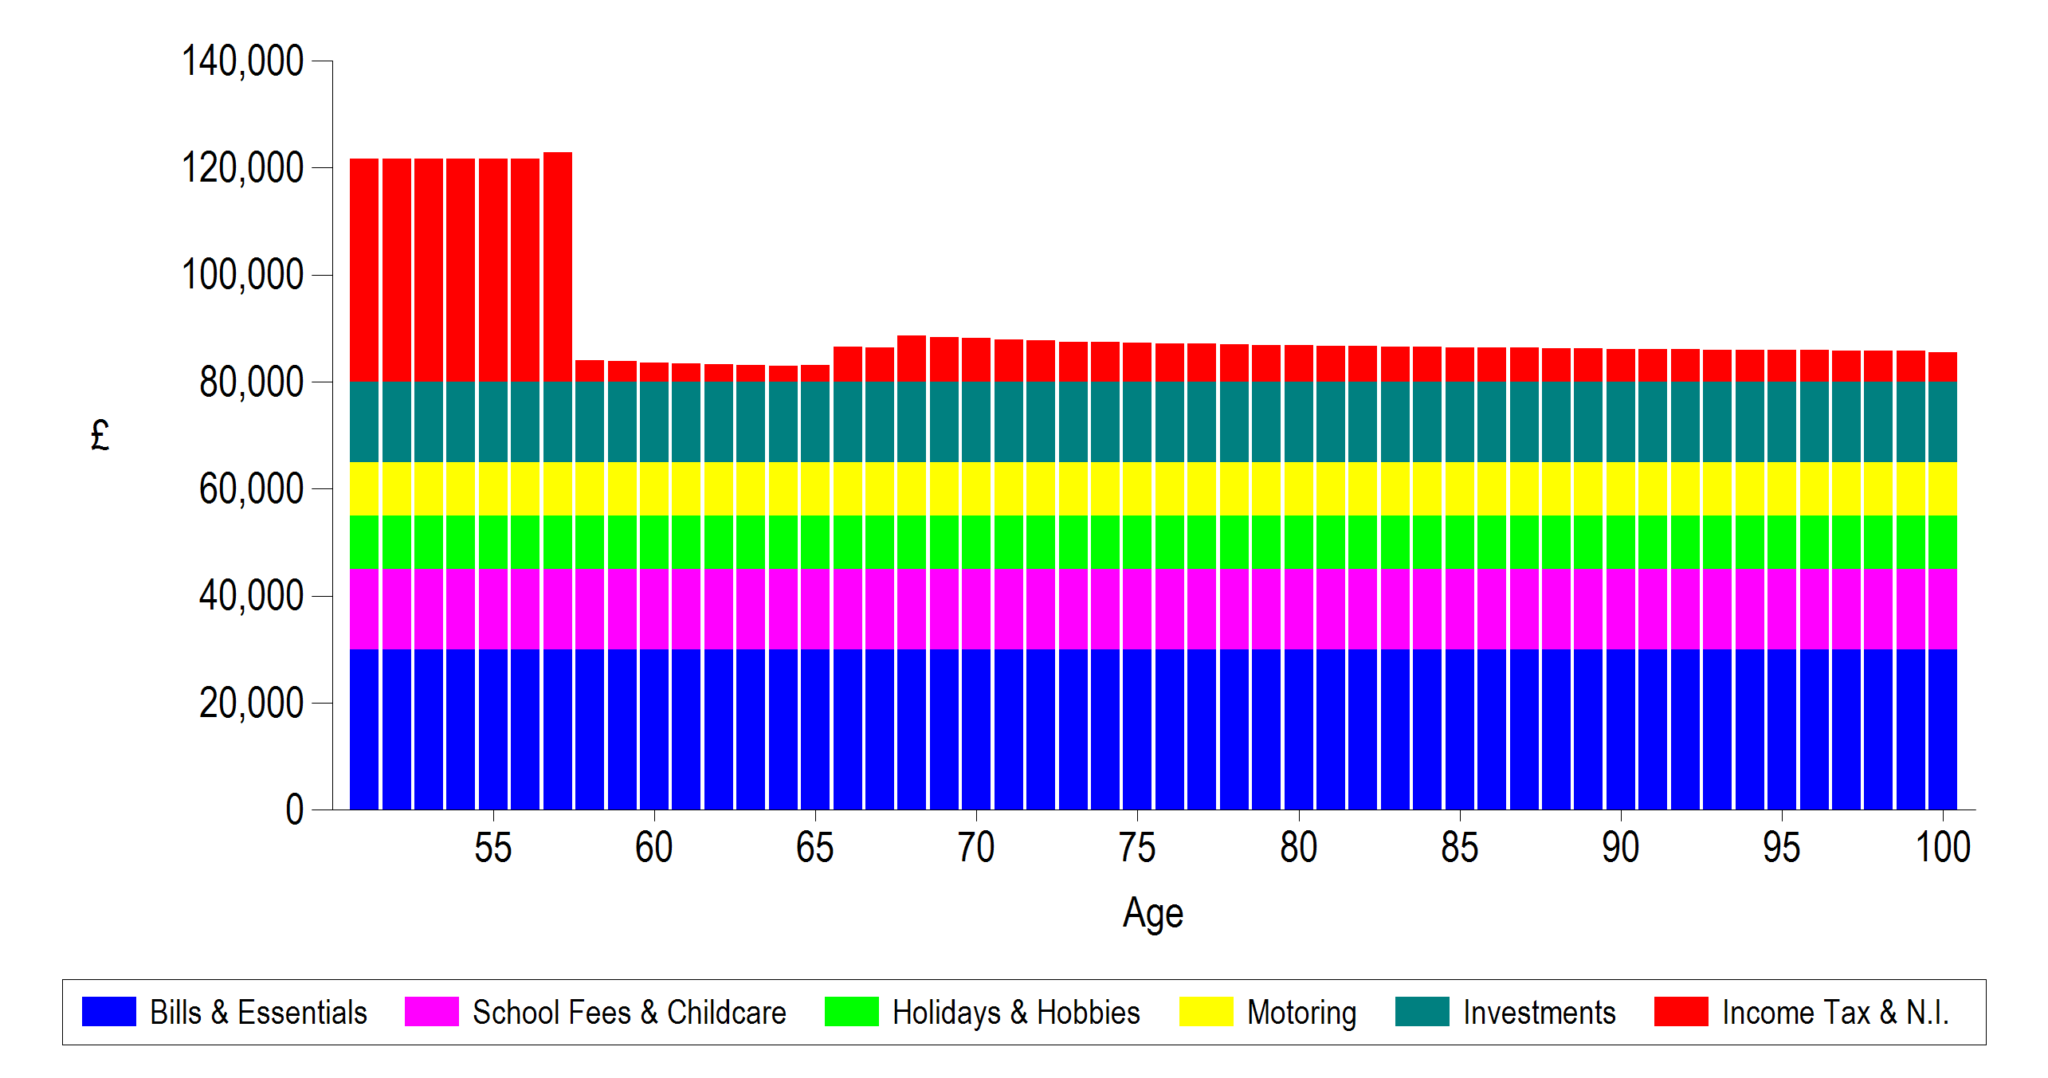
And now the questions start
The first thing to note about this chart is that it’s EXACTLY the same as the one above. However, this one is far more likely to pique the client’s curiosity.
The first expenditure chart we looked at was entirely unengaging. Clients will blindly stare at it, nodding their heads quietly, wondering if it’s too late in the afternoon to grab a Costa on the way home, or if they could squeeze in 9 holes of golf before they have to pick the kids up. The problem with unengaging charts (and unengaging meetings) is that clients won’t question things. Why should they, when they’ve told you they’re spending £80k a year, and that’s exactly what you’ve shown them.
But look at this latest chart…
“Why are you showing me school fees continuing up to age 100? The kids will finish school in about 7 years!”
“We’d ideally like to spend more on holidays in retirement…”
“I don’t think we’ll be driving beyond about 80, but I might want to buy a classic car when I retire. Can we look at that?”
A natural evolution
We often find clients start by providing the bare minimum information required. Used correctly, cashflow modelling can help clients better engage with the process of financial planning.
I remember one of our customers, who has now been using our software for over a decade, telling me about a, particularly difficult client. He refused to provide any breakdown of his expenditure – didn’t understand the need.
18 months later I was talking to him about the same customer. They had had an email from Sky offering them a new package, and he wanted to incorporate the change into his Truth® cashflow to see the impact!
We’re not saying you have to do it our way, but take a look at one final chart:
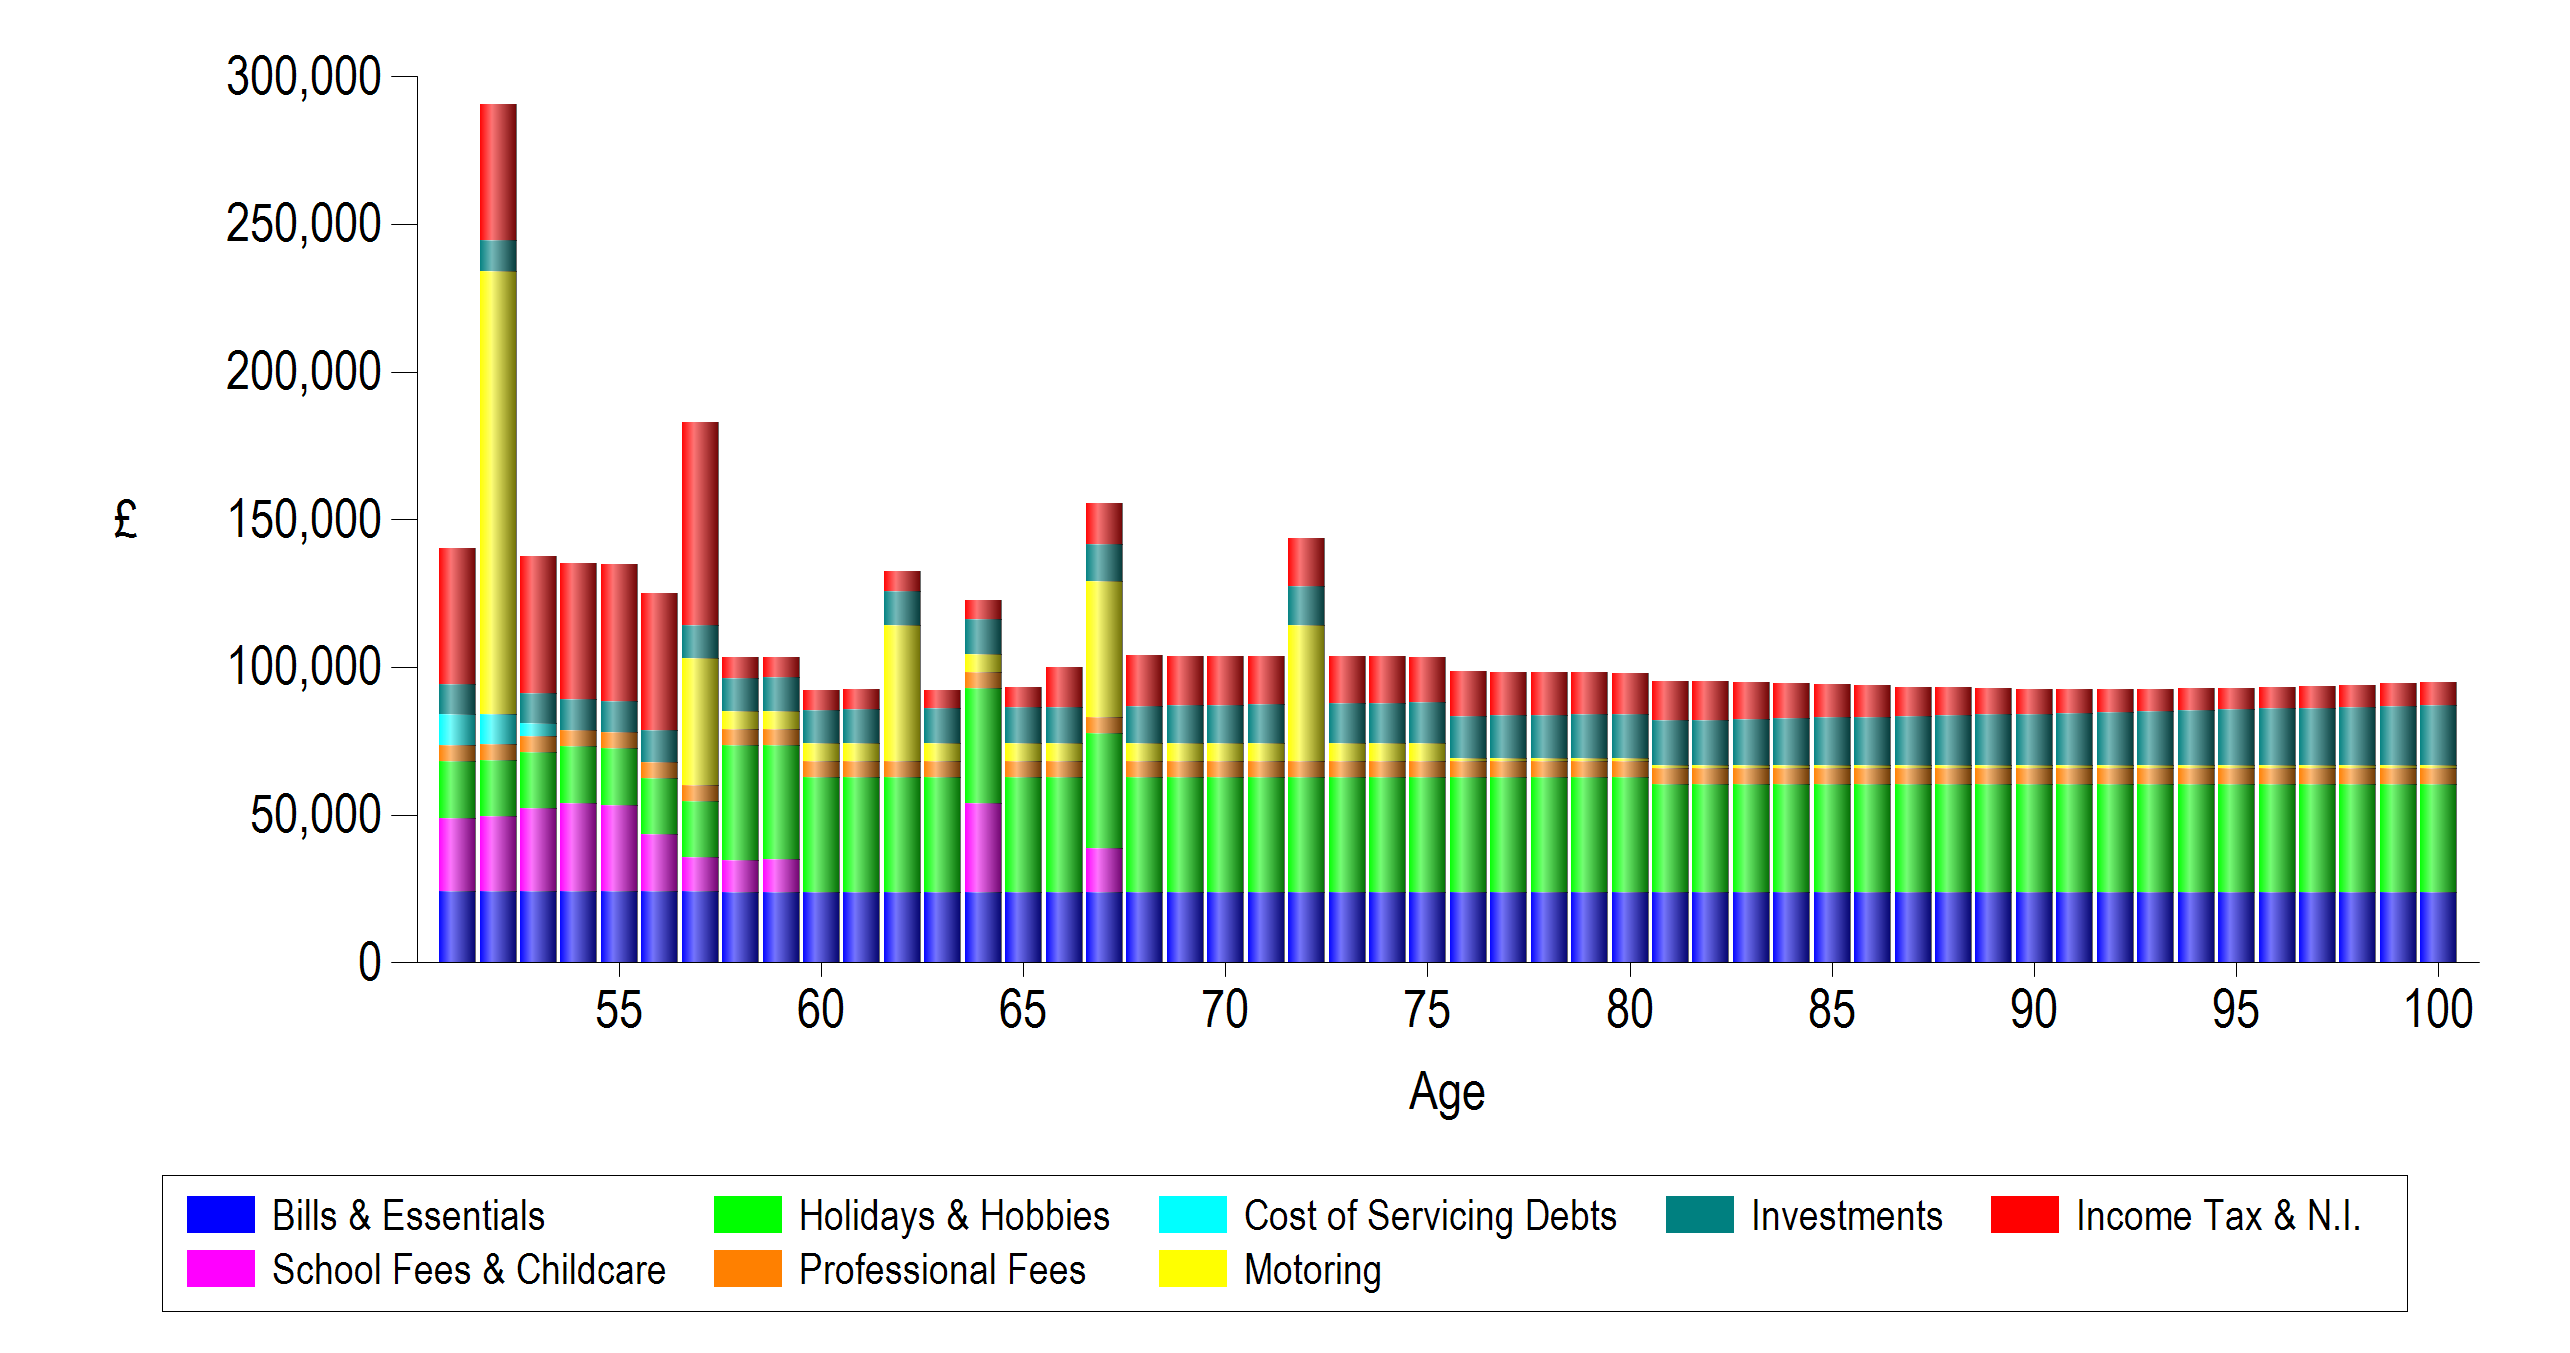
So what does this chart show?
- While Bills & Essentials stay the same throughout, there’s a host of other changes going on
- They’re increasing their Holiday spending at retirement, and planning to keep it that way for as long as possible!
- Michael and Jane are paying off their mortgage in a couple of years
- They’re buying that aspirational car before they retire, replacing their every-day cars every 5 years in retirement. They’re stopping driving from 80
In other words: it shows the rest of the clients’ lives – their wishes, dreams, and aspirations (at least in terms of spending) in one chart.
This is as close as you’re likely to get, in a planning meeting, to a portrait of the client. It’s no longer a chart which could possibly be confused with any other client of a similar age, in a similar financial situation. It’s most definitely a picture of your client. It may not take pride of place in the Louvre, but you could almost call it a masterpiece!
For assistance customising charts, amending categories, or just about anything else you can think of, please contact our expert support team.