30 mins CPD
Learning Objectives:
- Identifying sources for reasonable growth rate assumptions
- Understanding the impact of charges and inflation on investment return
- Incorporating inflation-adjusted returns into models
In this week’s post, we’ll look at the importance of the growth rates we use in cashflow models.
There are obvious implications to varying growth rates: the higher the return we illustrate, the better your cashflow will look. There are, however, some important considerations beyond simply the pure growth rates we use, including:
- should we use historic returns or projected returns?
- how do we incorporate charges into our projected growth rates?
- how do the growth rates used in cashflow models interact with your chosen inflation rate?
Expert Insight
We’ll look at all of the above in detail below. For now, here’s what some of our users model in terms of investment return:
Investment Return
Why is it important?
The growth rates we assume in a cashflow model are perhaps even more important than the inflation rate we choose to model.
Whether you choose to err on the side of caution, use projected growth rates, or use historic growth rates, the crucial consideration here is the real rate of return we model on client assets.
Einstein famously considered compound interest to be the most powerful force in the universe:
Compound interest is the 8th wonder of the world. He who understands it, earns it; he who doesn’t, pays it.
In an ideal world, clients would get the returns their portfolio advertise. In reality, however, there are two key drains on returns: charges and inflation. The compound impact of the small differences that charges and inflation make to a client’s cashflow over their lifetime can be very significant.
The cost of investing
Historically, different providers expressed their charging structures differently, making it difficult for advisers to understand the actual returns they might expect, let alone clients!
Clients paid Dealing Charges; Performance Fees, Admin Charges, Fund Manager Charges, Platform Charges, and Adviser Charges… many of these were incorporated into Annual Management Charges (AMCs); some weren’t. Sometimes these were supplemented by Annual Administration Charges…
Fortunately, since the FCA Thematic Review on the Clarity of Fund Charges (see Further Reading, below) in 2014, we have an Ongoing Charge Figure (OCF). OCF replaces the above with a single, transparent figure which shows the cost of investing in the provider’s fund.
When expressing growth rates in client cashflows, the first key consideration is how we incorporate charges. Some cashflow models look for a growth figure gross of charges and an OCF to offset part of this. In Truth, we express growth rates net of charges, but gross of inflation.
For example, if a client invests in a portfolio which aims to give returns of 8% with OCF of 1% and our model assumes inflation at 3%, we would input a growth rate of 7% (returns minus OCF) and our client would benefit from real returns of 4%(returns minus OCF, minus inflation).
The impact of charges
When looking at the eroding effect of charges on a portfolio: the higher the return we model, the less we see the relative impact of charges. A portfolio with a 10% return and 1% OCF would still yield 9% net return; a portfolio with a 1% return and 1% OCF would, of course, not grow at all!
This effect can be seen in the following chart:
The impact of a 1.5% charge on £1,000 invested at 5% over 10 years equates to a reduction of nearly 13.5% on the closing balance!
Inflation-adjusted returns
Even more important than the impact of charges is understanding the relationship between inflation and investment return for your cashflow models. Varying one without understanding the impact of the other can skew cashflows and render them completely meaningless.
This image shows a typical cashflow with inflation at 3% and investment return at 5%:

Inflation @ 3%, investment return @ 5% (inflation + 2)
Let’s see what happens when we reduce the inflation rate used in the model WITHOUT making allowance for the impact on investment returns:

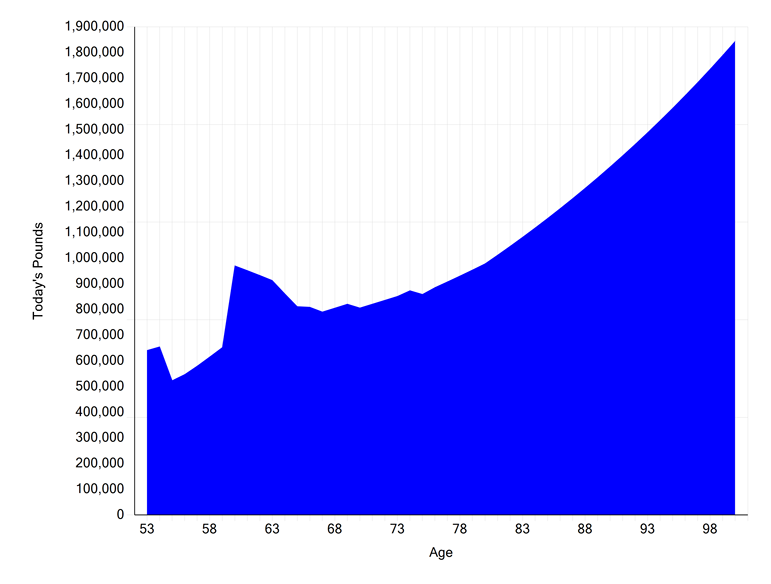
Inflation @ 1.5%, investment return @ 5% static
The cashflow is “better” for two key reasons:
- the client benefits from lower increases to their cost of living due to the low inflation rate
- investment returns are now 3.5% above inflation
It’s easy to see just how distorted the illustration has become. Rather than having £150,000 left at the end of projection, the client now has nearly £2,000,000, all by adjusting inflation without consideration on the impact on returns.
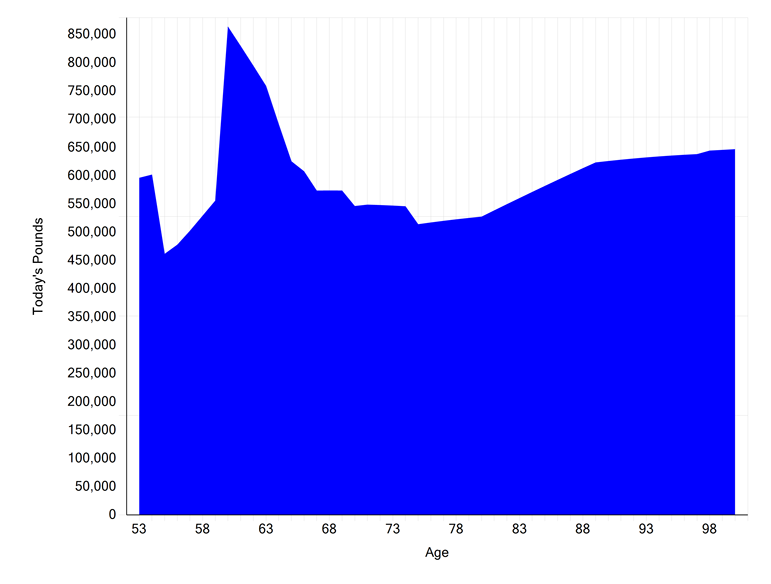
To further illustrate the interaction between these two assumptions, let’s take a look at what happens to this client’s cashflow if we keep inflation at 1.5% but now keep our investment returns at inflation + 2%:

Inflation @ 1.5%, investment return @ 3.5% relative
We’ve now taken away the second of the bullet points above: investment return is now 2% above inflation as it was in the initial cashflow. Any difference between the two is purely down to the impact of inflation.
By adopting a lower inflation rate we’re producing a more optimistic cashflow. To test this principle, here’s what happens if we increase the inflation rate in the same model to 4%:

Inflation @ 4%, investment return @ 6% relative
Despite increasing investment return at 6% rather than 5%, the same 1% increase to our inflation rate has a more significant impact on our clients’ cashflow.
When we looked at inflation, we concluded as follows:
Adopting a low inflation rate will result in a model showing slow growth in the cost of living, slow increase in index-linked income, rapid growth in income forecast to exceed inflation, and high real return on investments
Adopting a high inflation rate will result in a model showing faster growth in the cost of living, faster increase in index-linked income, slower growth in income forecast to exceed inflation, and lower real return on investments

Inflation @ 4% versus inflation @ 3%
An inconclusive conclusion
Unlike the other assumptions we’ve looked at, it’s harder to draw a consistent conclusion about investment return. Increasing investment return in isolation will make a client’s cashflow better, but caution should be exercised when varying growth rates without also varying inflation. Increasing (or decreasing) return without changing your inflation rate would reflect the impact of e.g. increasing the equity exposure in the client’s portfolio.
Providing your growth rates are adjusted for inflation, increasing investment return will also increase inflation (and so make your cashflow more pessimistic); decreasing investment return will decrease inflation (and so make your cashflow more optimistic).
What is reasonable?

In their Rates of Return for Required Projections document (see Further Reading, below), the FCA recommend a figure of 4% above inflation for equities and 0.3% for real corporate bonds. Depending on the asset allocation of your client portfolios, an inflation-adjusted figure on this scale of 0.3% to 4% based on equity content could be seen as both reasoned and reasonable.
If your preferred provider publishes projected return figures, these are also an excellent resource. When using provider figures, it’s essential to understand the inflation rate that is being incorporated into their projection. If your assumption for inflation is different, make appropriate allowances or use providers’ anticipated Real Return figures.
It’s also worth noting that providers’ projected figures can be very pessimistic. I recently saw a provider projection where a portfolio had grown historically by over 4% per annum compound, but they recommended 1.4% for future projections.
Whatever rates of return you choose to model, your reasons for choosing these should be documented and the assumptions revisited regularly.
Further reading
The following are useful resources when deciding on and documenting your assumptions and the reasoning behind them:
FCA TR 14/07 – Clarity of Fund Charges
FCA Rates of Return for Prescribed Projections
Government Actuaries Department (GAD) Mortality Insights: Modelling Future Life Expectancy


