

Back in July, the FCA published PS22/9, announcing the new Consumer Duty requirements that firms will need to meet, moving forward. At that time, we wrote a blog looking at how the need for legislation just to ensure “good outcomes” for clients reflects poorly on financial advice, as a profession.
With implementation plans now well in place and the new rules coming fully into force on 31st July 2023, we wanted to a look at where cashflow modelling fits into the Consumer Duty puzzle. So, let’s run down three of the key ways in which cashflow modelling can help you exceed your regulatory requirements and get yourself ready for Duty.
Product or service?
The “products and services outcome” element of “the Duty” focusses on ensuring that the products and services you supply to consumers meet their needs and are fit for purpose. One of the most important aspects of this outcome and area of oversight is ensuring that the products and services you offer meet the “needs, characteristics, and objectives” of your clients.

The FCA is talking here about the needs, characteristics, and objectives of a segment of your client bank, rather than individual clients. But, regardless of whether we’re looking at a cross-section or an individual, what better way of evidencing the fact that you understand your client’s needs than a report which breaks these needs down? What better way of detailing their objectives than a report which itemises and prioritises them? And why not achieve all of this with a financial plan, framed around a cashflow model?
One of the questions we’ve been asked more times than we care to remember, over the years, is “should I only offer cashflow modelling to my top clients?” And the answer is… er… maybe! It depends on the characteristics of your… “not top” clients. Perhaps you have a segment of your client bank that only want you to manage their investment portfolio. Maybe you think their needs don’t require cashflow modelling. In my experience, almost all clients can benefit from cashflow modelling. Whether it’s a simple model that gives them visual confirmation that all is on-track or a complex model which indicates the level of pension input they need to achieve a certain outcome, the value of cashflow modelling (as we’ll cover later) is peace of mind. How would each segment of your client bank answer the question “would you value increased peace of mind, when it comes to your finances”?
Even though all clients might benefit from cashflow modelling, as we’ve talked about previously we should take pains NOT to treat cashflow modelling as another product to sell to clients. Lifelong cashflow planning should be seen as something that enhances your service, rather than a product to peddle.
By incorporating cashflow modelling into your client proposition, you are demonstrating an understanding of your client and how your service helps meet their needs and objectives.

Quantifying value
The next outcome, under the Duty, is “price and value”. Evidencing value added is one area in which, traditionally, many investment-focussed advice firms struggle, particularly during periods of rocky market performance.
As part of the Duty, the FCA is looking to adopt a more data-driven approach to oversight. We’ve already established that cashflow modelling should be something that enhances the service you provide to clients, rather than a product you sell. We’ve also seen, from a qualitative perspective, how it enhances that proposition and helps ensure that your advice is tailored to your clients’ specific needs and objectives. But how do we quantify the value that this adds, for clients? If cashflow modelling forms part of your service proposition, we need some way of putting a figure on its importance and recording MI ready to present to the FCA.
There have been seen some fantastic articles, over the past few months, suggesting client questionnaires as a fantastic way of capturing this data. I won’t be the first, or the last, to echo this sentiment… but I might have a slightly different take on it. Rather than simply asking a client, either before or after a review meeting, whether they are confident about their financial position, or whether they understand the advice you have given, how about something a bit more nuanced?
Imagine, for a moment, you have a meeting coming up with a client. Prior to the meeting, you send the client a link to a questionnaire with just a couple of simple questions, for example:
On a scale of 1-10:
- How confident do you feel about your financial future?
- How well do you understand the products and investments you currently own?
- How clear are your financial plans for the next twelve months?
- How clear are your plans, beyond this period?
You record your clients’ responses to these questions then, the following week, you meet with them. A few days after your meeting, you send them the same questions. The pre-meeting results are your benchmark; any improvement is a quantitative indication of the value of the service you have provided during your meeting.

Perhaps you could add in some more leading questions, such as
During our recent meeting:
- What helped to improve your understanding of your financial situation?
- What helped to improve your confidence about your financial future?
Subjective responses are perhaps not as “valuable”, in pure MI terms, as seeing a client’s confidence rating go from a 6 pre-meeting to a 9 afterwards. But not all data is numerical. Having a statement on file saying how the cashflow model you presented to them, or your matter-of-fact explanation of their situation improved their confidence or understanding is just as valuable in illustrating how you are meeting your Consumer Duty requirements.
Of course, you can also quantify the Pound value of the tax you’re saving your client; the IHT they might save because of some trust work you’re doing for them; or how much more they have available to spend in retirement, following your pension advice. But, for an oversight regime designed to focus on consumer understanding and positive outcomes, what could be better MI than your client’s direct feedback on the value that your advice has added to their situation?
A picture paints a thousand words…
I once had the misfortune of receiving a critical yield illustration for a DB pension transfer. This document ran to over a dozen pages, with countless almost-identical tables illustrating the impact on the sustainability of the receiving fund of various different growth rates and withdrawal strategies. As a consumer (albeit one with passable knowledge of financial services), it bored me almost to tears. My willingness to understand it (and my desire to go on living!) waned as I read on.
Human beings are, by our nature, visual creatures. Even those of us who are capable of digesting and understanding a dozen pages of critical yield tables take no pleasure from doing so. But provide the same information in a graphical form and you increase your client’s ability to understand the information and retain its meaning significantly.
This table shows the value of a client’s £240k pension fund over a 20-year period with drawdown of £18k/annum at 4%, 4.5%, and 5% return:
| 4.0% Return | 4.5% Return | 5.0% return | |
| Year 1 | 230880 | 231990 | 233100 |
| Year 2 | 221395.2 | 223619.55 | 225855 |
| Year 3 | 211531.008 | 214872.43 | 218247.75 |
| Year 4 | 201272.248 | 205731.689 | 210260.14 |
| Year 5 | 190603.138 | 196179.615 | 201873.14 |
| Year 6 | 179507.264 | 186197.698 | 193066.8 |
| Year 7 | 167967.554 | 175766.594 | 183820.14 |
| Year 8 | 155966.257 | 164866.091 | 174111.15 |
| Year 9 | 143484.907 | 153475.065 | 163916.71 |
| Year 10 | 130504.303 | 141571.443 | 153212.54 |
| Year 11 | 117004.475 | 129132.158 | 141973.17 |
| Year 12 | 102964.654 | 116133.105 | 130171.83 |
| Year 13 | 88363.2403 | 102549.095 | 117780.42 |
| Year 14 | 73177.7699 | 88353.804 | 104769.44 |
| Year 15 | 57384.8807 | 73519.7251 | 91107.911 |
| Year 16 | 40960.276 | 58018.1128 | 76763.307 |
| Year 17 | 23878.687 | 41818.9278 | 61701.472 |
| Year 18 | 6113.83449 | 24890.7796 | 45886.546 |
| Year 19 | 0 | 7200.86467 | 29280.873 |
| Year 20 | 0 | 0 | 11844.917 |
Pretty dry stuff, right?
This cashflow chart shows the same data over the same period with the same outcomes:
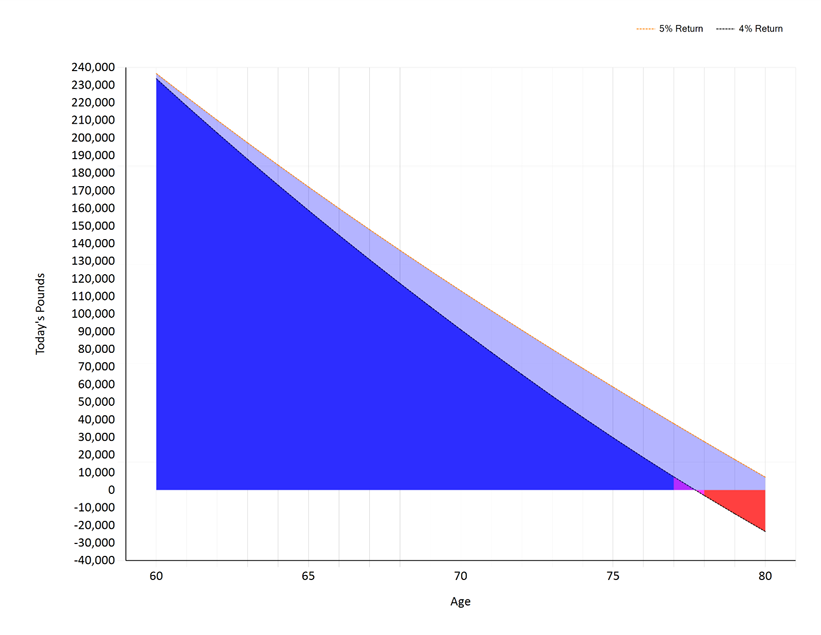
Which do you think provides a clearer message?
Clients don’t (and shouldn’t) care whether their pension fund might hypothetically be worth £23,878 or £61,701 in 18 years’ time, they just want to know how much is enough. By all means, supplement the picture with the thousand words, or include it as an appendix to tick off a compliance requirement, but don’t forget that all the client cares about is quite literally the big picture!
Nothing in life is to be feared…
Having provided comprehensive lifelong cashflow modelling software for financial planners, advisers, coaches, and wealth managers for nearly forty years, there is one recurring phrase that we consistently hear from our customers: “peace of mind”.
Clients come to you with problems, questions, or concerns. “Can I afford to retire?”, “What will happen to my family if I die?”, “What happens if my portfolio tanks?”. Of course, we can answer these questions with numbers. We can tell clients that they can afford to retire at 62, rather than 65; or that they require an additional £432,000 worth of life assurance. But why tell them when we can show them? And, by showing clients a visual representation of their financial future, we’re not only solving their problems, answering their questions, and addressing their concerns. We’re helping them to truly understand their life choices.
“Nothing in life is to be feared, it is only to be understood. Now is the time to understand more, so that we may fear less”
Marie Curie
Someone once told me that every assumption in a cashflow model is a stress test. Assuming a client might live to age 95 when statistically it’s unlikely they’ll do so – stress test. Assuming inflation will be slightly higher than economists’ projections – stress test. Assuming conservative growth rates on clients’ portfolios – stress test. We don’t baffle them with figures or overload them with pages of data, we show them a simple picture and the high-level assumptions that feed into it. And, by showing clients that, even with all of these stress tests, everything is going to be OK, we deliver a service with tangible value that can be easily understood. In other words: peace of mind.