
30 mins CPD
Learning Objectives:
- Understanding the key features and limitations of deterministic cashflow models
- Assessing capacity for loss
- Illustrating the impact of uncertainty on clients’ lifestyles
The FCA’s guidance on Capacity for Loss rightly emphasises the importance not only of quantifying the impact of losses, but also of communicating this to clients in a way they can understand.
In this blog, we’ll answer some key questions:
- how can we illustrate capacity for loss to clients in a way they can really understand?
- how can we bring this into the context of cashflow and lifestyle?
- what are “reasoned and reasonable” assumptions to use for market crash illustrations?
Expert Insight
We’ll look at all of the above in detail below. For now, here’s how some of our customers approach modelling market crashes.
Market Crashes
Why are they important?
In order to understand the value of modelling market crashes, it’s important first to appreciate the basis of the model you’re working with.
There are two kinds of cashflow modelling: stochastic and deterministic. I won’t go into the differences in detail here, it’s something we cover in-depth in this blog post.

Truth®, and most other cashflow modelling tools currently available in this country, is primarily a deterministic tool. This means that we use static assumptions which reflect an average of the growth we expect to see.
The growth rates we assume in deterministic cashflow models already incorporate the volatility of future investments. If a portfolio aims to deliver returns 4.57% above inflation, this isn’t to say that clients will get 4.57% real return every year. In fact, they are unlikely to get 4.57% returns in ANY year. There will be years when they gain 20% and years when they lose 20%.
The graph below shows the last 20 years of the FTSE 100 index. Between 2001 and 2021 the FTSE 100 grew by 1,243.1 points. This gives an annualised return of 5.05 points (just 1.05%). While actual returns have fluctuated wildly, this is the average return over the period. This average is what we use to project forward in our deterministic model.
Source: https://uk.investing.com/indices/uk-100-historical-data
The importance of timing
One of the questions we are often asked is “why can’t we model a crash in 5 years’ time, then another in 15 years; another in 25 years…?” That’s exactly what we’re modelling! The growth rates projected in a deterministic cashflow model already incorporate the fluctuations of financial markets, they’re the red line in the chart, above. A deterministic model’s “average” growth rates by definition incorporate a number of market crashes and recoveries.

Having accepted that regular crashes and recoveries will definitely happen, illustrating capacity for loss to clients is not a question of IF a crash will happen, but WHEN. When we model a market crash in Truth, we are modelling a single adverse market event that occurs on top of the regular crashes and recoveries our model already incorporates. What if the client suffered a catastrophic loss at the point at which they are most exposed to risk?
The timing of the crash is critical. If markets crash while clients are in a period of accumulation, they can benefit from pound/cost averaging. If the same crash were to occur during a period of decumulation, the client would suffer from what has been dubbed “pound/cost ravaging”.
While traditional Risk Profiling questionnaires ask questions like “what percentage of your portfolio would you feel comfortable losing”, cashflow modelling allows us to frame this in the context of its impact on clients’ lifestyles. Would a 20/30/40/50% loss at a specific moment jeapordise your future plans?
In other words: cashflow modelling allows us to give clients a visual indication of how poorly-timed losses may impact on the affordability of their lifestyle.
The impact of strategy
Along with timing, the other key consideration is what is happening to the portfolios we’re crashing both at the time of the crash and during the recovery period. To illustrate this, let’s take a look at the impact of a 30% portfolio loss with a 6-year recovery period (we’ll talk more about how I arrived at these figures below) on a client’s £1.2m pension fund.
In both scenarios, our client has an income need of £40k. In the first scenario, they are funding this by way of UFPLS – annual withdrawals of part tax-free cash; part taxable income. In the second scenario, they take their PCLS up-front, then a taxable drawdown income which their fund can sustain for the rest of their life.
Scenario 1 – Annual UFPLS:
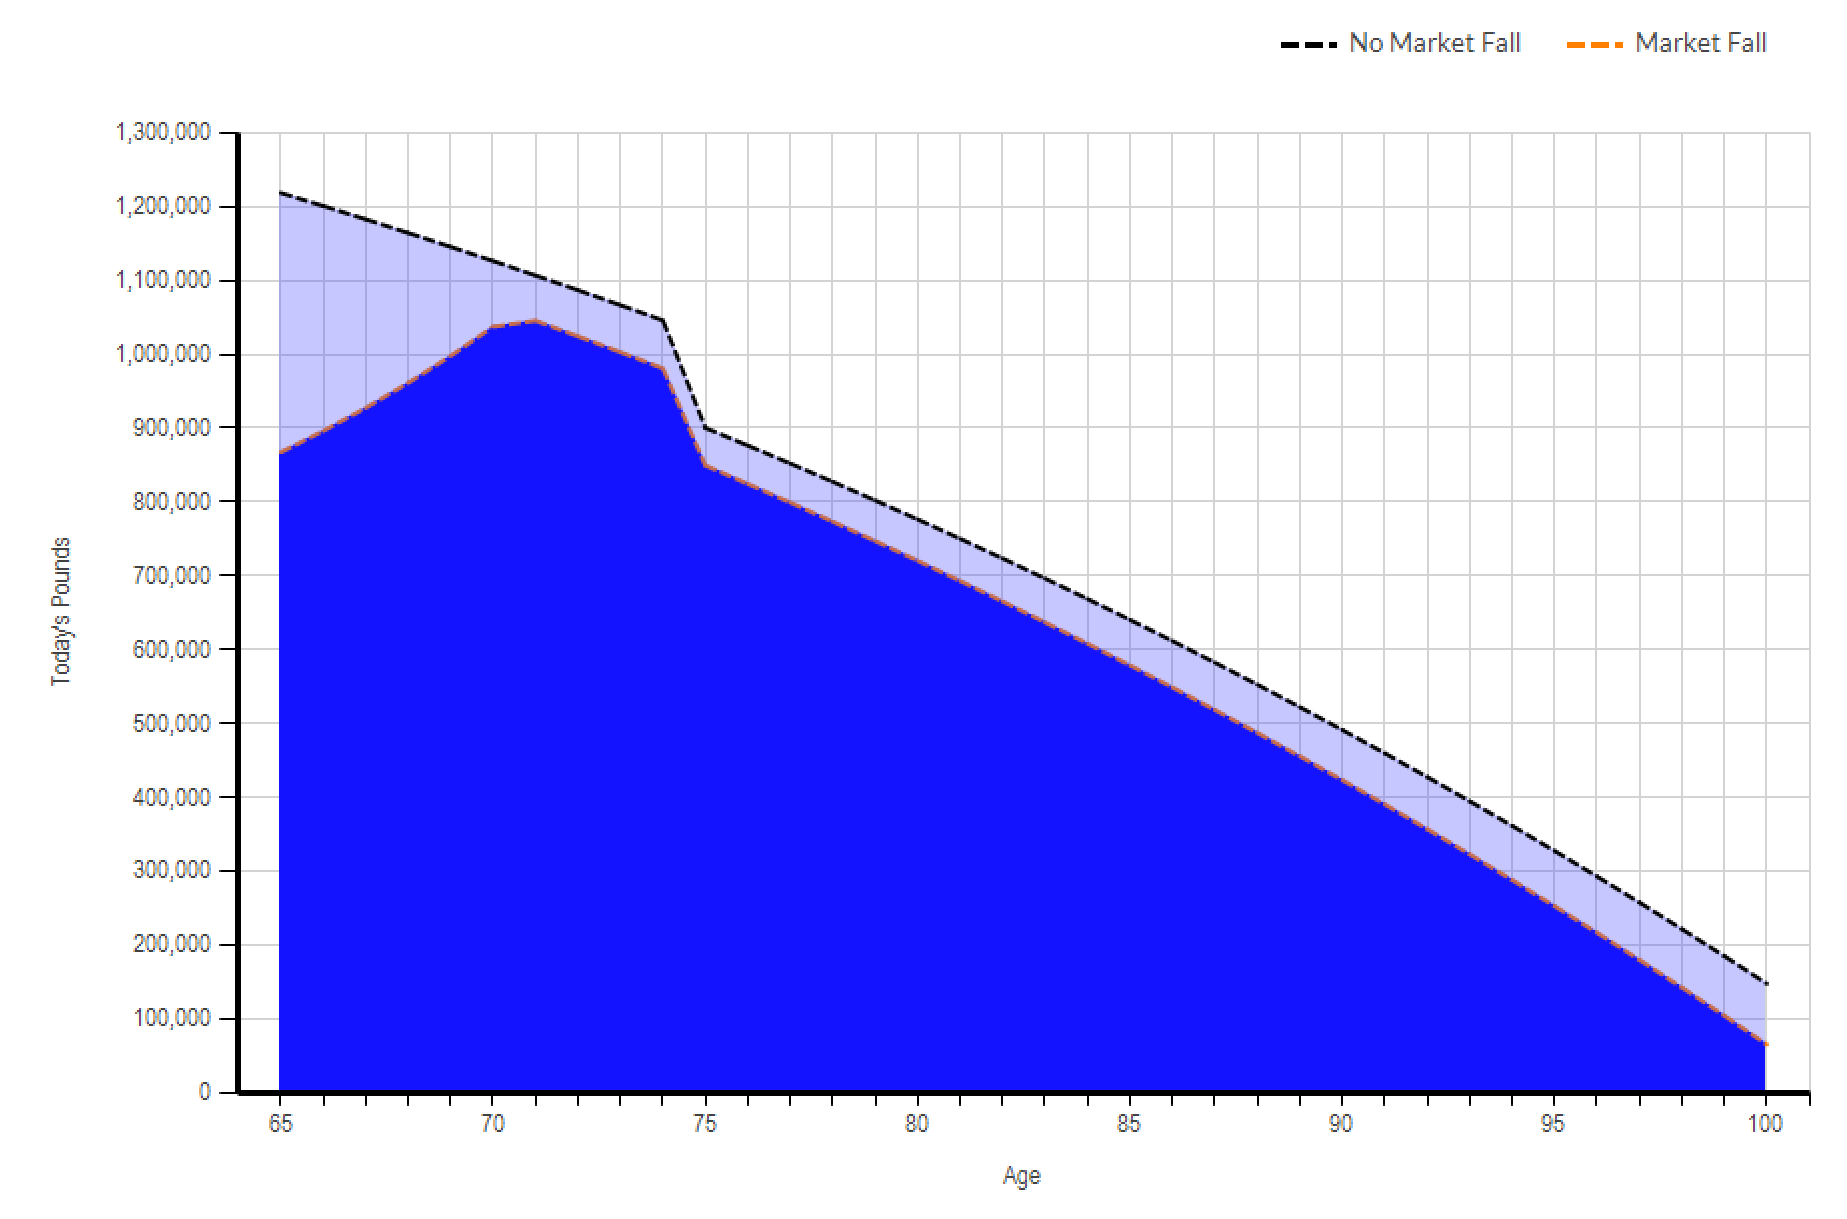 This is a cashflow capital chart in Truth. It illustrates a client’s liquid capital position now and projected forward for the rest of their life. In this example, we’ve included pensions as part of the client’s liquid capital to emphasise the point.
Where the client takes income from the pension via UFPLS, their portfolio immediately falls by 30% (£360,000) from £1.2m to £840,000.
During the 4 years of adverse market conditions, the client continues to draw £40k income each year from this depleted pot. After 6 years, they have stripped out £240,000 from the fund, which has benefited from the period of accelerated growth we typically see after a crash.
They are left with around £1m in their pension, just in time to pay a hefty Lifetime Allowance charge at 75! Although their pension never recovers to “pre-crash” levels, they have sufficient capital to last them for the rest of their lives.
Scenario 2 – PCLS then drawdown:
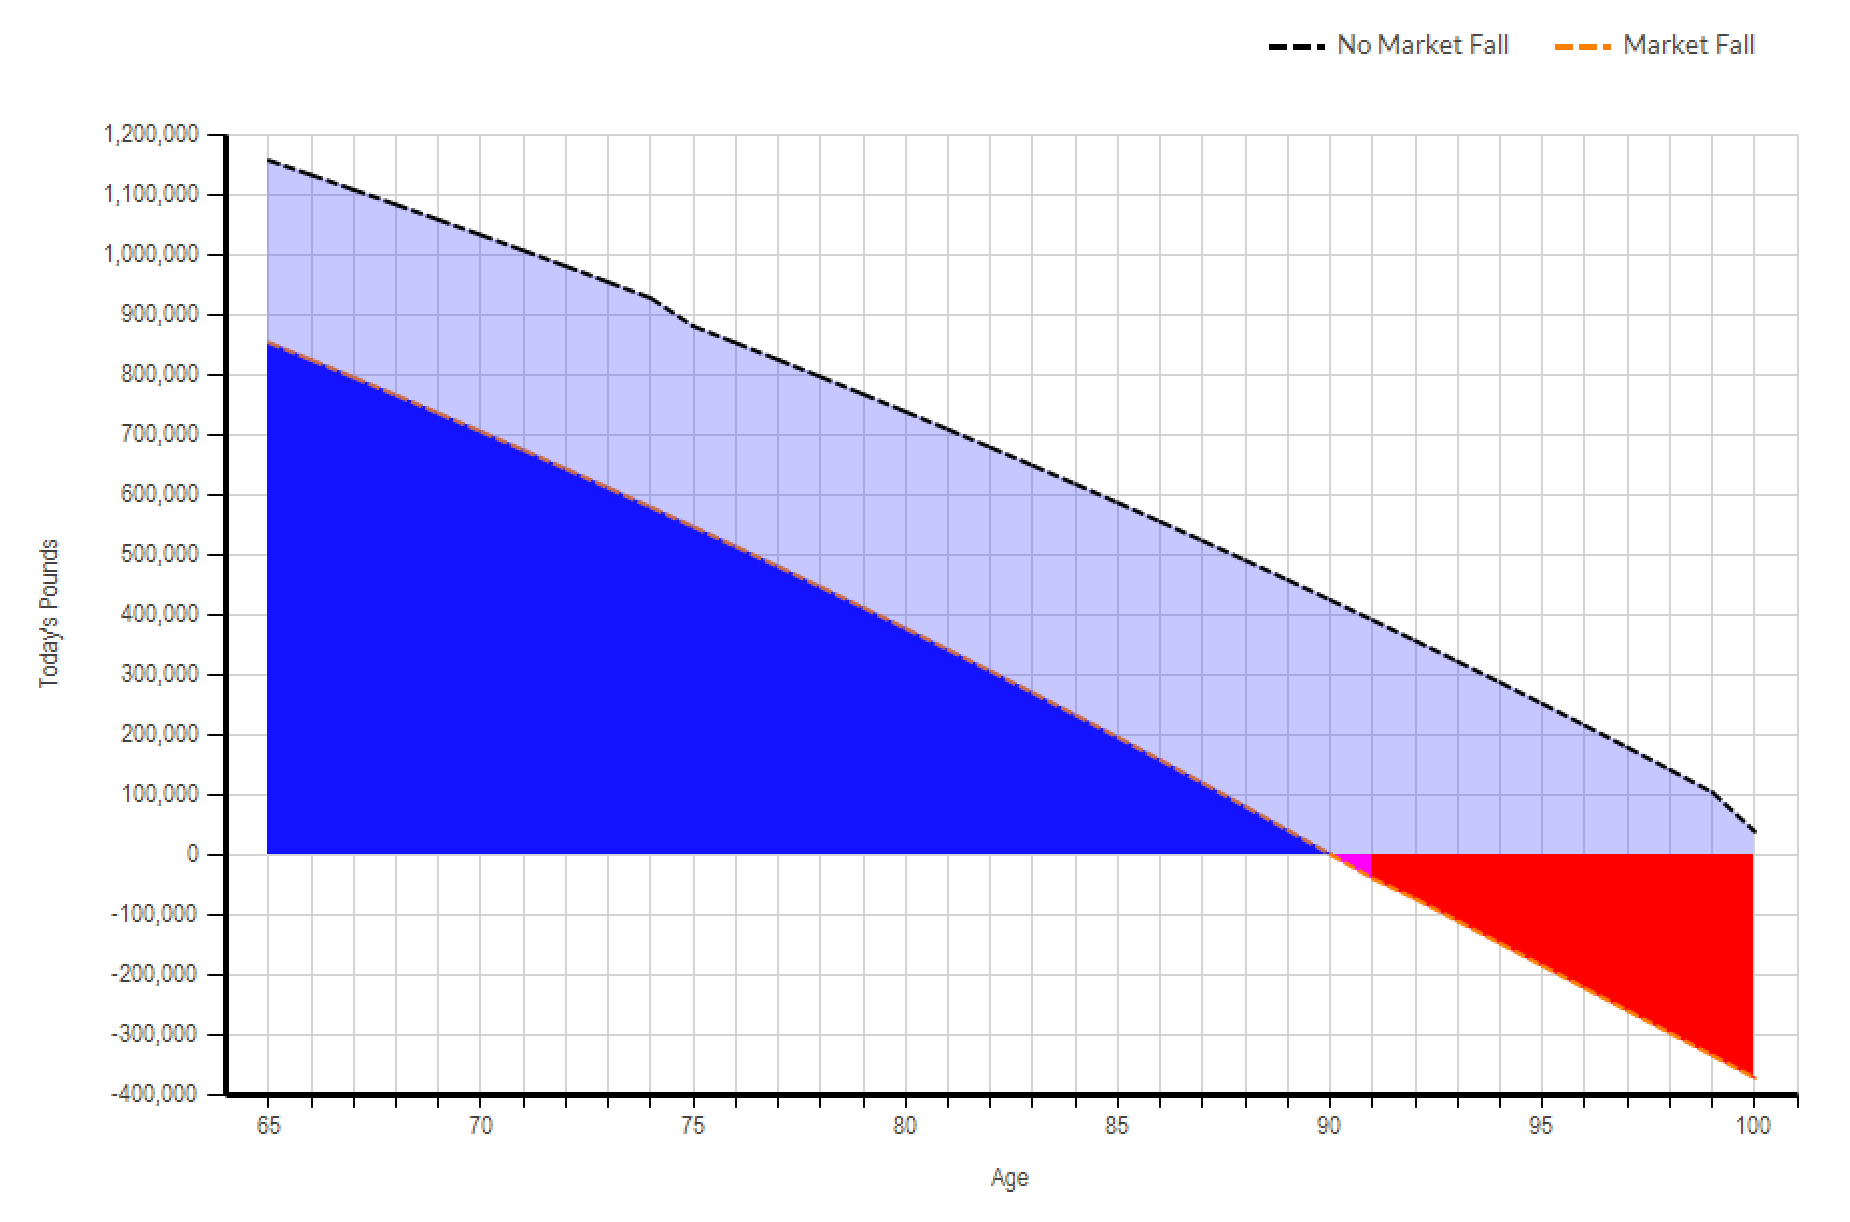 In this scenario, the client instead opts for flexi-access drawdown on the full pot. Their portfolio immediately falls by 30% (£360,000) from £1.2m to £840,000.
While the client still benefits from accelerated growth on the 75% of their fund that remains in drawdown; the damage to the invested PCLS is permanent.
Because taxable income is now drawn from just 70% of the remaining 75% of the fund (i.e. the fund crashes by 30%, having paid out 25% PCLS), they are effectively working with a fund worth just over HALF that shown in our first scenario! The taxable income they draw during the period of the crash erodes the residual fund far more rapidly.
After 6 years, they are around £350k behind where they would have been pre-crash, and this gap only widens. They are left with around £600k in their pension – the only consolation being that they now skirt below the Lifetime Allowance!
Rather than have an income that would be sustainable beyond their anticipated lifespan (see this post on longevity for more discussion on that point), they run out of money at around age 89.
We’ve deliberately adopted two extreme strategies here to highlight the impact on the client’s cashflow. Of course, our client would be unlikely to crystallise the whole of their pension, extracting all available tax-free cash in the aftermath of a catastrophic market crash. As with all aspects of cashflow modelling, it’s important to communicate to the client that the model is wrong. It’s purely a decision-making tool that helps them visualise the potential implications of their financial choices – it’s crucial that the model is updated, reviewed, and revised frequently to ensure that it remains in line with their position and future needs and objectives.
What’s clear is that withdrawal strategies can have a dramatic impact on a client’s capacity for loss. Our cashflow model gives a transparent illustration of the client’s exposure to risk, whatever strategy they choose to adopt.
What is reasonable?

While researching this blog, I’ve had access to some fantastic stats from a range of DFMs. These have included figures on the worst historic falls their portfolios have suffered, as well as longest periods “underwater” and peak-to-trough times. While these vary widely from DFM to DFM and fund to fund, there are some pretty clear patterns.
In the vast majority of cases, 60/40 portfolios have been unlikely to fall by more than 20-30% and have recovered within 40 to 48 months. The greater the equity exposure, the sharper the loss, but the recovery period remains largely the same.
When it comes to market crash parameters, there’s little need to explain a “rule of thumb”. The larger the crash and the longer the recovery, the more cautious the client’s cashflow will be.
When modelling market crashes, I tend to use a 30% fall. Based on historical evidence, this is in line with the worst annual losses experienced by a portfolio with around 80/20 equity weighting. Any portfolios with lighter equity weighting would be less adversely affected by market events.
In these same simulations, I will model a six-year recovery period. While markets tend to recover from shocks or crashes in less than 2 years (markets recovered from the COVID crash in around 12 months), historical data indicates that there have been instances when portfolios have remained below their starting value for up to 48 months following a crash.
The assumptions we use in our cashflow models often err on the side of caution. Market crashes are no different. Modelling a 30% crash and a 6-year recovery period for a client with low equity exposure is no different. We’re already taking average rates of return; we’re projecting beyond “average” life expectancy; we’re using an inflation figure that may be higher than reality.
Remember, the projected growth rates you assume in your deterministic model already incorporate the volatility of financial markets. That inflation plus 4% return figure your DFM recommends using for future projections on their 60/40 portfolio is an average. It incorporates the years in which they will get returns of 15% as well as the years in which they will lose 20%, both of which are utterly inevitable. Modelling a significant adverse market event isn’t really a question of whether they have the capacity to withstand a loss, but rather whether they have the capacity to withstand a loss at a specific point in time.
We’re not trying to shock clients, we’re looking to pre-empt and reassure. Showing the impact of a market crash is no different to projecting up to age 100 for a client whose life expectancy may only be 87. By going beyond what might reasonably be expected, we’re simply stress-testing the client’s strategy and providing robust financial advice.
Further reading
The following are useful resources when deciding on and documenting your assumptions and the reasoning behind them: